Board logo

标题: [技术分析] Perfect Wave - 2012-1/2 (II) [打印本页]

作者: snowrider    时间: 2012-4-12 00:08     标题: Perfect Wave - 2012-1/2 (II)

(I) = http://www.yayabay.com/forum/thread-183033-1-1.html
作者: snowrider    时间: 2012-4-12 00:09

Quote from ScalperJoe:

Got it, thanks.  However, I'm curious as to how you get the 960 target, and what is the scenario for it to occur this year?

If it breaks 1,320 then perhaps it goes flatline to around 1,250-1,290 range during mid-summer (near mid-point of 5 wave pattern which began last October), before closing out in the black for 2012.

Without some climactic event (war, lack of additional QE, hyperinflation, Euro/dollar collapse, etc), I'm not sure the market is poised break the prior two years of intrayear lows and to fall to 960.  I'm not suggesting it won't retrace on the larger wave count eventually, just not by the end of this year.

Your thoughts, comments?


ScalperJoe - Thanks for nice commenting.  About the 960 area target, it is just at a 0.382 fib ratio from 2009-03 lo to the recent hi.  I would like to take back what I mentioned last time about the timing of the end of this year.  I mentioned that because I wanted to load something for next year by the end of this year.  The actual timing could be 2013-09 to see the big cycle low.  When the time is there, and when the price is at a fib ratio (say, 0.5 at 1045), that will be an excellent opportunity to load.
作者: snowrider    时间: 2012-4-12 10:07

Quote from toc:
Snowrider,

given that you have been doing the EW for sometime now, what percentage of your calls prove to be good.  have never been into EW although use Fib retracements etc. at times.


toc - The successful rate of my purple lines (preferred counts) is about 50% (half-half), so it is nothing special and nothing significant by simply following my purple lines.  However, the good thing and advantage of using EW for trading because it provides some strict rules so that we know where to go and where to stop once our preferred counts are wrong.
作者: 1235678    时间: 2012-4-12 11:19

把你也放了吧,以后我要问你炒股的事,可要好好告诉我呀。
作者: snowrider    时间: 2012-4-13 00:42

把你也放了吧,以后我要问你炒股的事,可要好好告诉我呀。
1235678 发表于 2012-4-12 11:19


謝謝 38妹
作者: snowrider    时间: 2012-4-13 09:47

Quote from ScalperJoe:

snowrider,

Given the recent swings in SPX, is it safe to interpret the past five down bars as "A" and today's snap back rally as "B" of Wave 4, which may last a few more days, followed by a "C" wave back down?  The way I read the current pattern, the SPX falls below its current 50 day moving average of 1,370 again, thus completing the A-B-C pattern in Wave 4.

However, I find the difficulty in EW analysis is in attempting to pinpoint the accuracy of when Wave 4 ends and when Wave 5 begins, until of course after the fact!
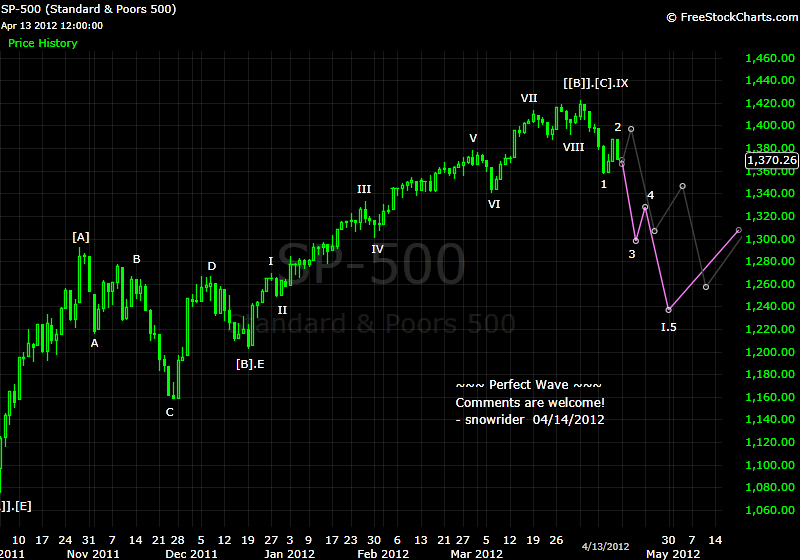
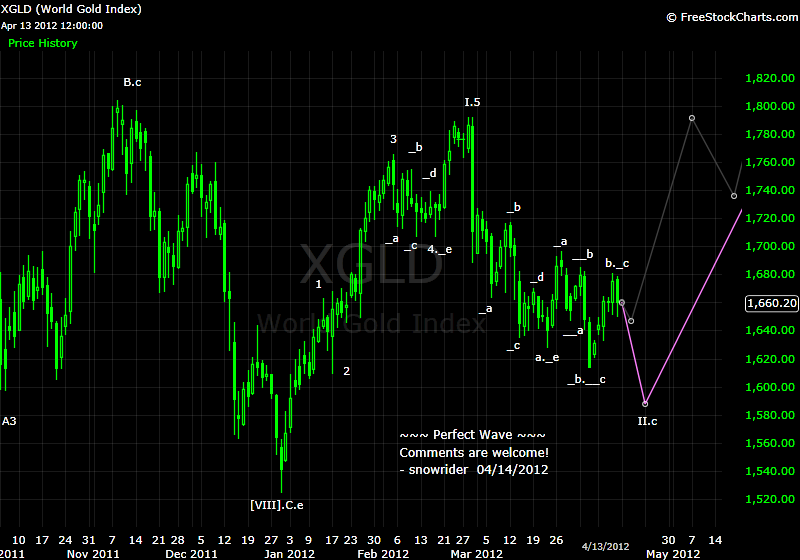
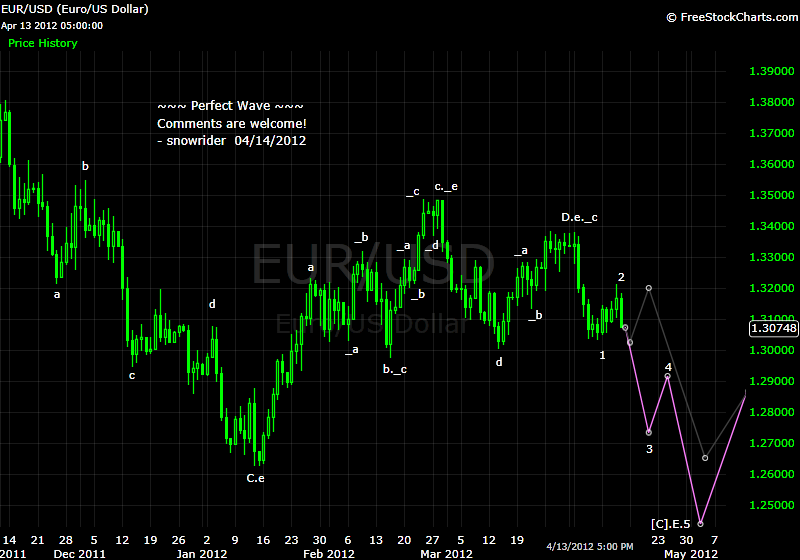
ScalperJoe - Yes, that is a way of counting this if we predict that the downward movement is in ABC mode.  Another way of counting this is to treat the 5 down bars as wave 1 of the downward movement, so we just about finishing wave 2.  There are many other ways of counting this.  My trading philosophy is trying to lay out as many possible counts as I can, and then watch those critical area to see if there is any reversal sign (in order to confirm which count is more likely and to trade).
作者: snowrider    时间: 2012-4-13 15:45

偶實在不希望它今天來個黑色星期五 雖然要是真來了 偶EDZ及TLT將大賺 但是偶卻沒機會加碼期指了 ... 大家看看歷史上的黑色星期五及黑色星期一許多次了 1987 的那次是偶還懵懵懂懂的剛剛下海的時候就碰到了 ... 這市場有這個味道 ... 希望不要這麼快 ...
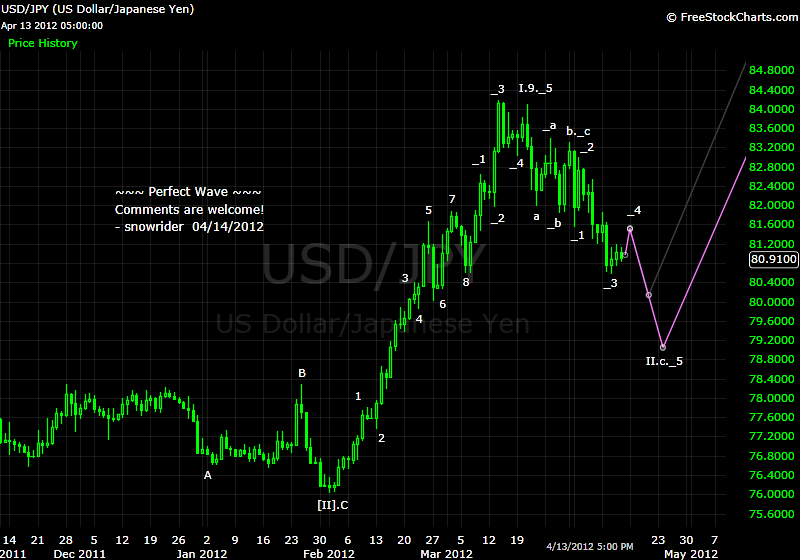
作者: snowrider    时间: 2012-4-15 00:30

04/14/2012

Comments are welcome!


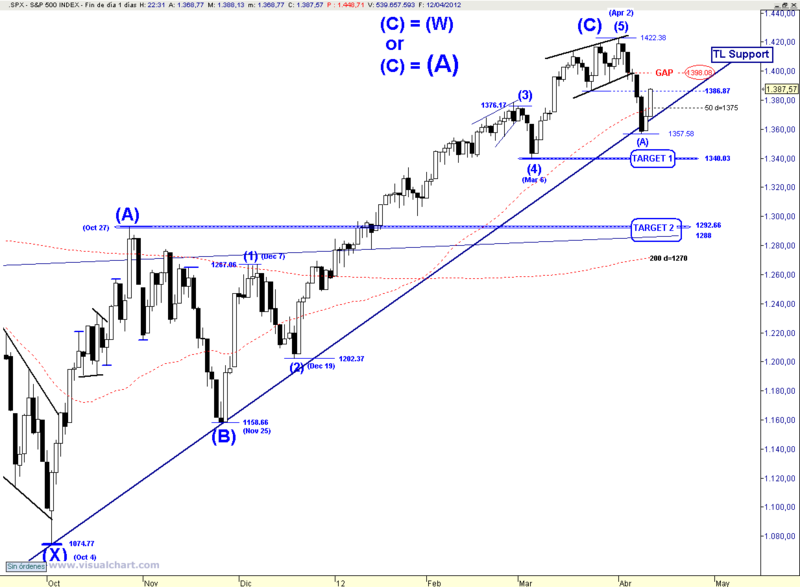
作者: snowrider    时间: 2012-4-15 22:38

snowrider,
the count of the "thewavetrading" since the oct. 2011 low for the S&P is more logic for me than yours:


Sixer
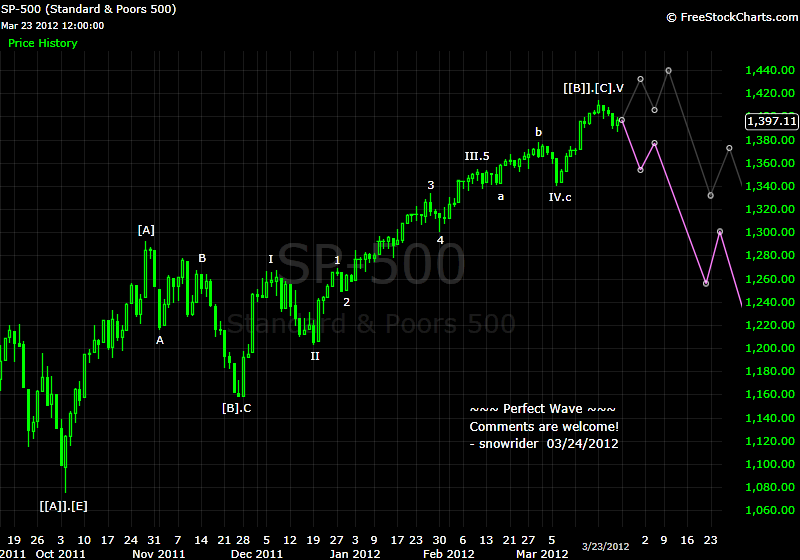

Sixer - Thanks for sharing your thought!  Yes, yours is a valid and good count.  I have had similar count before changing to the current one.  If we count that way, the wave-IV (your (4) wave) could also be counted as a flat.  See the following old post:


And your count:

作者: snowrider    时间: 2012-4-16 14:26

前兩天也有人跟偶討論到這個 這個偶沒貼 現在貼

Quote from EliteThink:

[B]the odds of that occuring in an election year for the spx are low.  1325-1340 should be solid support. [/B]


EliteThink - Thanks for sharing your thought!
作者: snowrider    时间: 2012-4-19 16:38

are you bullish on SPY for mid-term since you are holding UPRO
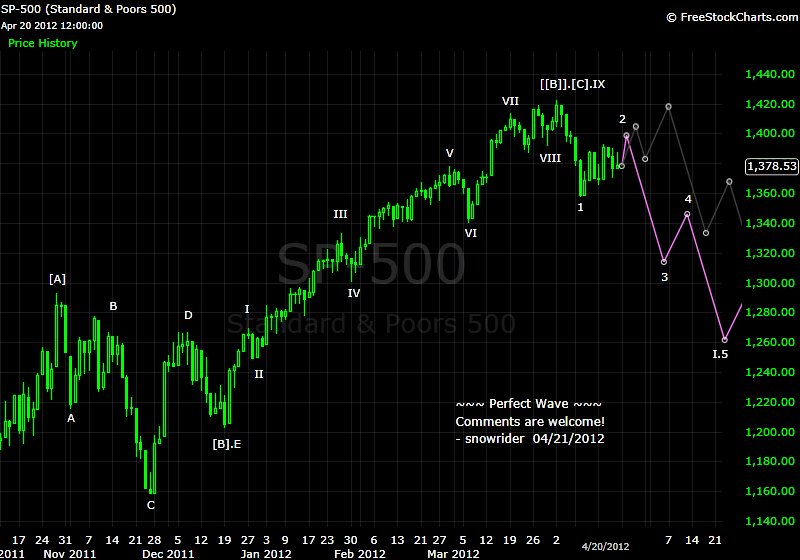

問得好!  偶中期及長期都看空 ... 看大空頭!  但是偶不確定的是中期 目前偶波的算法是[A]-[B]-[C] (over) 然後向下數 ... 偶不知它是否會走成 [I]-[II]-[III]-[IV]-[V] where the [I] is the [A],  [II] is the [B], [III] is the [C] ... 所以偶持有UPRO以防萬一有個[V]上去.
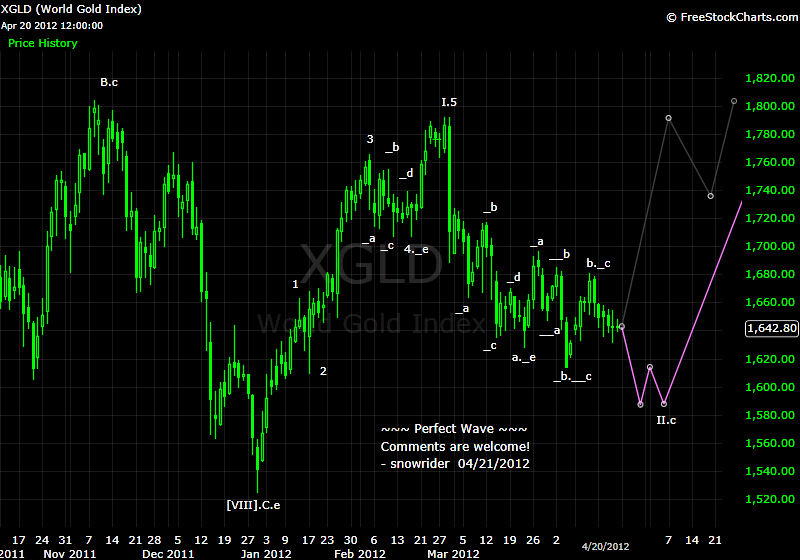
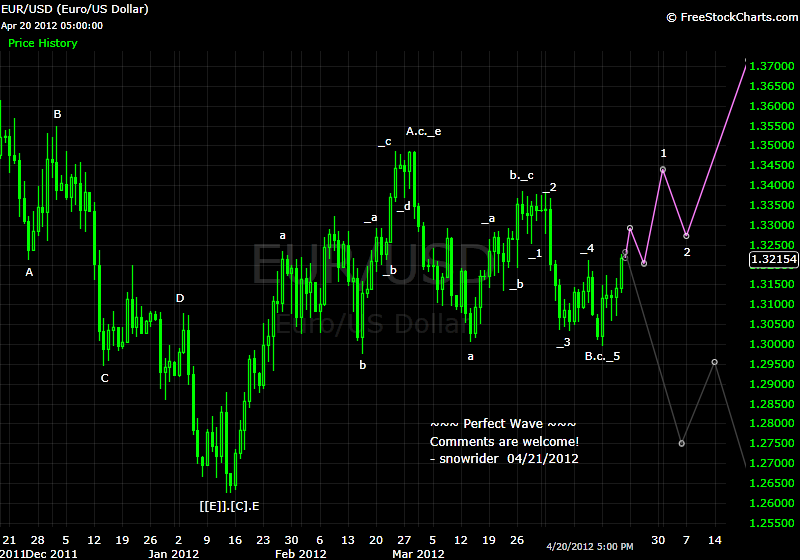
作者: snowrider    时间: 2012-4-21 22:06

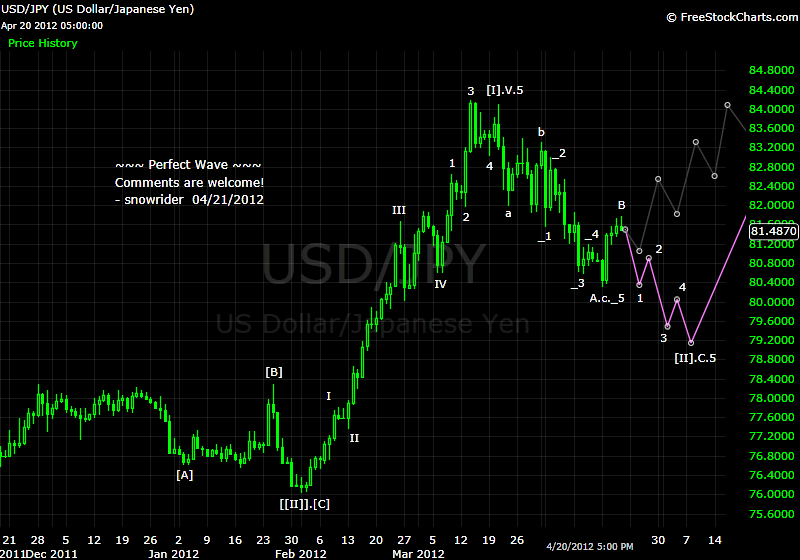
04/21/2012

Comments are welcome!


作者: knock    时间: 2012-4-21 23:42

EURUSD和SPX为啥背离那么厉害?
作者: snowrider    时间: 2012-4-22 00:00

EURUSD和SPX为啥背离那么厉害?
knock 发表于 2012-4-21 23:42


knock - 它們之間沒有任何關連性  
作者: snowrider    时间: 2012-4-22 12:09

Quote from Wide Tailz:

So we all anticipate the SP500 coming down from the bear flag.  This consensus makes me nervous... traders rarely agree!


Wide Tailz - Thanks for commenting.  I am nervous too because the market won't let people make money so easily.  See my purple line wave count has a wave-2 in a bull trap formation.  I would like to see a pop before the market starts moving down.
作者: knock    时间: 2012-4-22 17:50

knock - 它們之間沒有任何關連性
snowrider 发表于 2012-4-21 20:00

请教一下:一般认为美元涨则美股大盘跌,欧元美元跌,所以看起来过去几个月有这样的共振。从这个角度看还是有关联的。能否明示一下?谢谢!
作者: snowrider    时间: 2012-4-22 19:24

请教一下:一般认为美元涨则美股大盘跌,欧元美元跌,所以看起来过去几个月有这样的共振。从这个角度看还是有关联的。能否明示一下?谢谢!
knock 发表于 2012-4-22 17:50


knock - Good point!  妳提出一個恢常好的觀察  是的  有時它們會有共振現象(正向或反向)  如果我們要以觀察一個東西的走勢來判斷另一個東西的可能走向  那將會是令人失望並且是一種十分危險的假設  因為兩者之間的互動實際上是因為第三者(第四者...第N者)的因素所造成  say,
X -> A
X -> B
We cannot conclude that A -> B 或是 B -> A

偶引述一段以前偶登過的:

大部分的人都會關心 市場之間的關聯性
偶到是一點都不 care
因為看過許多從正相關變成負相關或變成不相關
偶們大部分看到貨幣貶值股市漲  但也有過長期一塊漲或一塊跌的 (e.g., 最近美元與美股就是一塊漲跌的)
若追根究底  總是可以查出背後漲跌的原因  但對偶這個 TA purist 來說 ... I don't care
偶做哪個市場就看哪個圖  不管任何其它市場的任何圖
若是走FA路線的人 可能想要搞清楚 市場之間的關聯性
若是走TA路線的人 建議還是將它當成黑盒子 不要理它 輕鬆簡單又愉快
作者: knock    时间: 2012-4-23 00:52

回复 17# snowrider

受教受教。感谢耐心解释!想起来,黄金过去和大盘相反,后来因为受美元影响又和大盘走势类似,也是个活生生的例子。
作者: snowrider    时间: 2012-4-26 23:29

谢谢雪骑老大!那么牛啊,啥时候到3600啊?另外,在那里可以看到老大如果更新A股的图呢?


maopao  -  偶一直就是只有看著上證指數圖  而沒有精確測量  所以 3600 是偶在圖上隨手一指的點位  既然妳問了  那偶就認真得看看  好了  偶要修正目標:

因為浪[A]走了9個月1813(3478-1665=1813)點  浪[C]在時間及幅度上一般不會小於浪[A]  所以保守估計為先看等幅等時距:
01/06/2012@ 2133 (起漲點) + 9個月1813點 (等幅等時距) = 9月底10月初@3946
剛好3895是6124下跌到1665的50%
所以偶會留意:  3895~3946 的這個區間

偶沒有在貼上證指數的圖  上次是剛好大牛他聊到  所以偶就提供些個人的猜測
作者: snowrider    时间: 2012-4-27 01:58

那雪骑觉得国债和股市的关系呢? 他们之间的反向关联呢?


王嫫嫫 - 謝謝討論  這個回到以前聊過關於相關性的話題  簡單一個回答就是不要關心不同市場之間的任何互動

http://www.yayabay.com/forum/red ... 400&pid=5178589

在過去N年中  偶看過許多一段時間是T-Bond漲股市漲  也看過許多一段時間是T-Bond漲股市跌  舉例說明:

T-Bond漲股市漲 - 債券拍賣結果特好  市場期待利率走低  雙雙連袂上漲
T-Bond漲股市跌 - 經濟衰退股市大熊市  錢進債市  負相關

結論 - 這個追根究底是要了解什麼是背後的因素 (太累了!)  最好就是不要管它們的關聯
作者: snowrider    时间: 2012-4-28 16:33

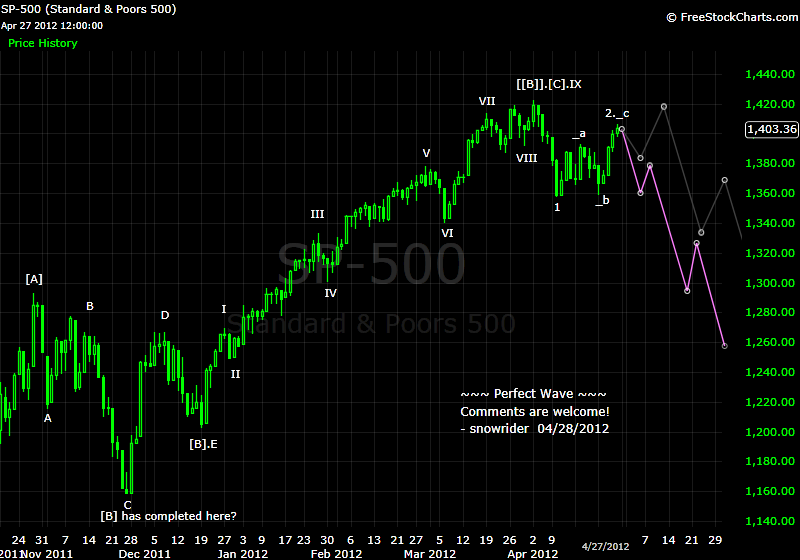
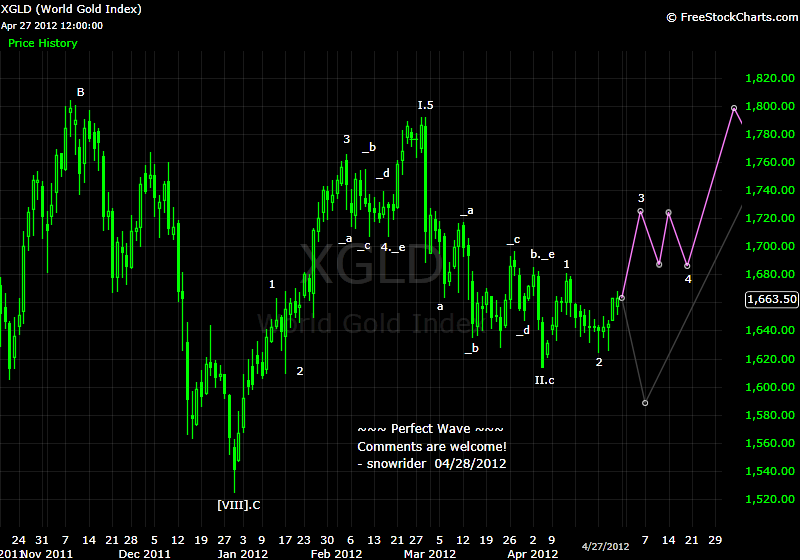
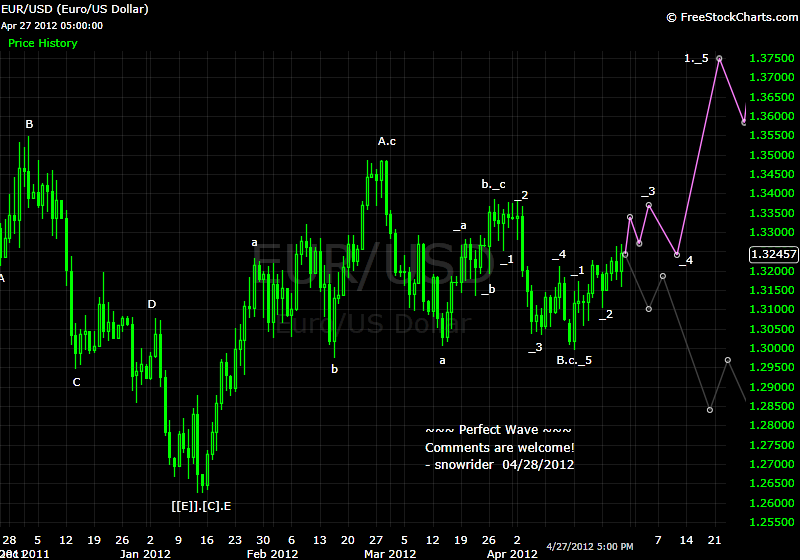
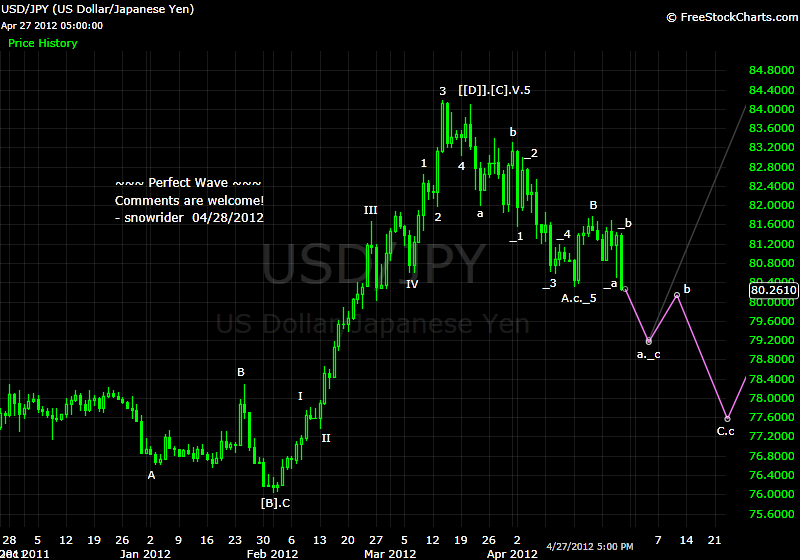
04/28/2012

Comments are welcome!


作者: snowrider    时间: 2012-4-30 01:42

Quote from Wide Tailz:

That looks very logical.  Chop like this makes me so angry some days!

Perhaps I can see a hypnotist to get me to stop trading during corrective waves.  They are unpredictable.


LOL ... cheer up man ... I have been losing money in this corrective wave.  A trend will eventually come back.
作者: snowrider    时间: 2012-4-30 01:47

Quote from ammo:

post bank intervention it's much easier to manipulate ,no bear stearns to pick off the whales,eom and expo seem to always work upward,snow,thanks for putting this out there


ammo - You are welcome, and thanks for reading and commenting.
作者: snowrider    时间: 2012-4-30 01:52

i hope you did take the easy long on EU 27 april at 1.3178 it was the obvious one for 75 pips


TravoltaImp - Actually, I missed out that long because of last Friday's choppy market move.
作者: snowrider    时间: 2012-4-30 02:02

你很确定sp下一步要大跌啊

fatbrick - 偶不太確定!

... 不过也是, 再上的话, 新高的可能性很大. 看DOW现在样子, 不拔高不甘心啊.

Venetian - 偶只是瞎猜的  如果市場向上破高點 偶可能會先避避風頭 再找機會放空

昨天gdp调整都没有撼动MM的牛心,没招了

常打盹 - 也許吧!  不管怎樣  偶還是偏熊些
作者: snowrider    时间: 2012-5-1 23:08

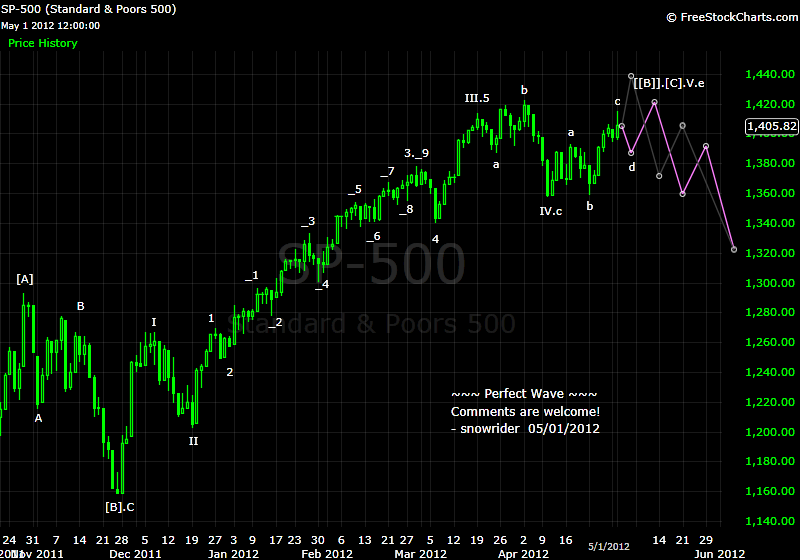
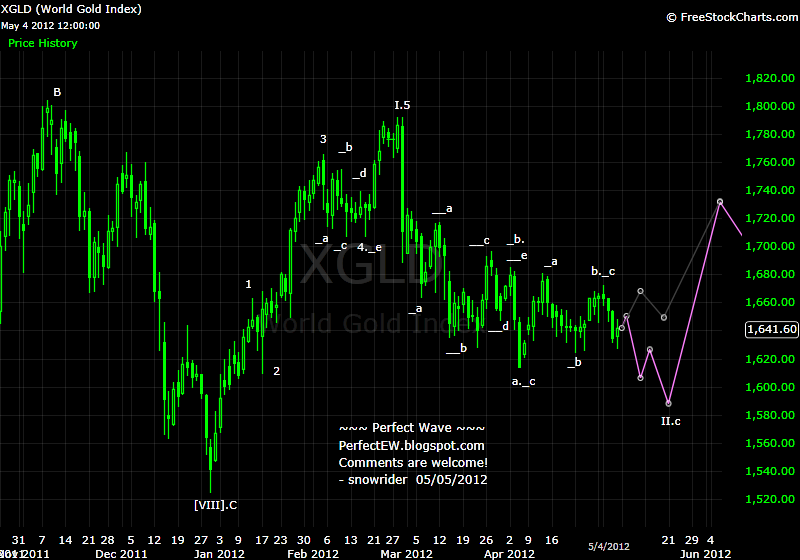
05/01/2012

Comments are welcome!

So ... possiblly an ending diagonal triangle is forming.


作者: snowrider    时间: 2012-5-5 19:26

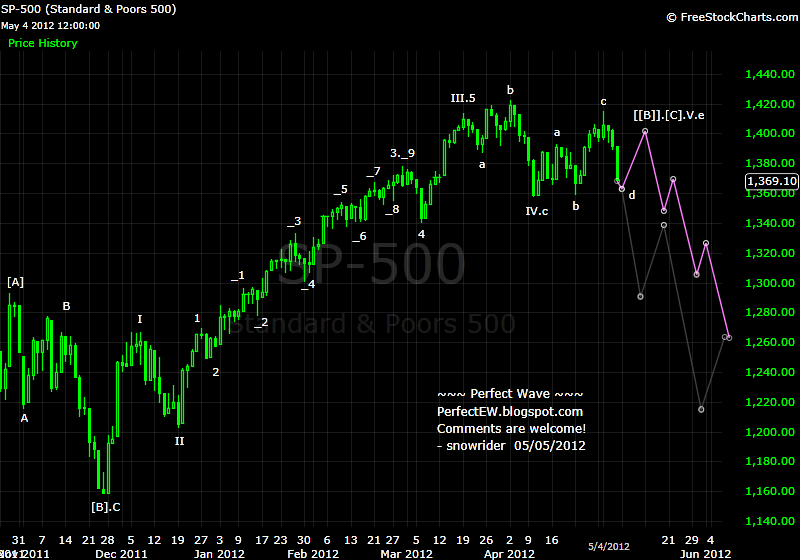
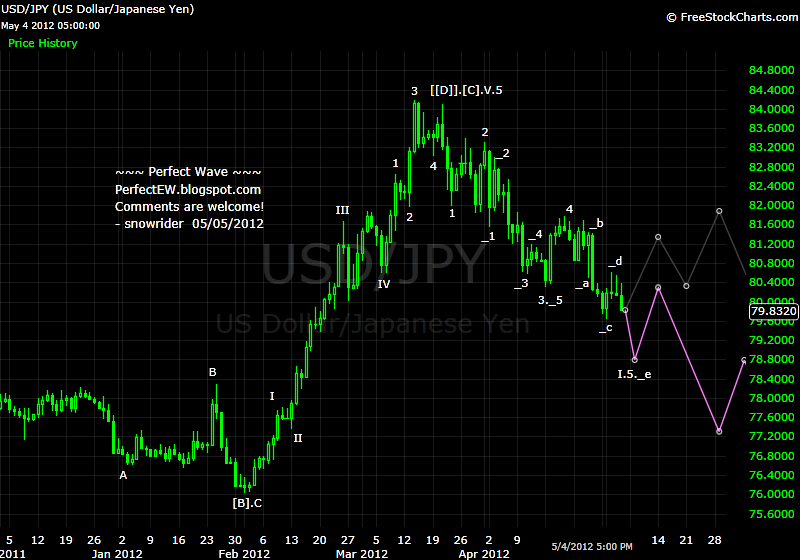
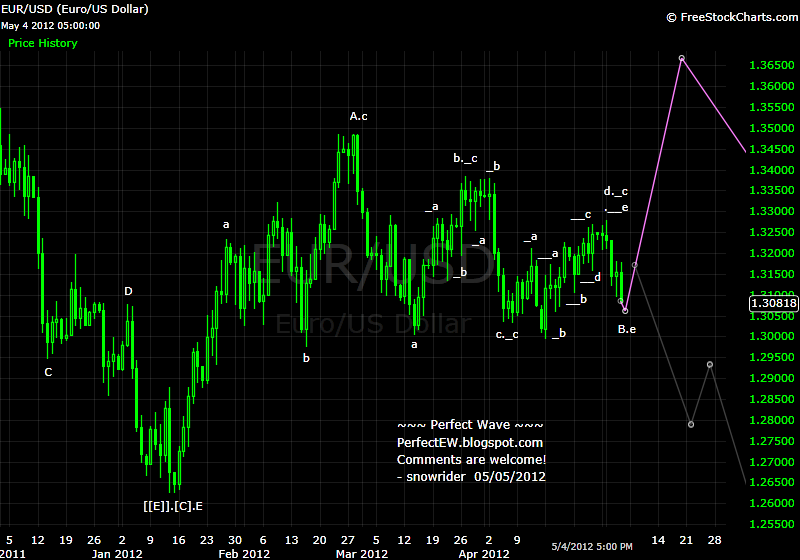
05/05/2012

Comments are welcome!


作者: snowrider    时间: 2012-5-7 02:00

目前的低點達到等幅跌幅目標  但波圖的紫線已無效  現在走灰線  整個波的算法回歸 04/28/2012 的算法
作者: snowrider    时间: 2012-5-7 09:28

It's good that SP futures pulls up a lot before the market opens.  We will need to watch to see if the cash index would fall below the starting point of last up waves - the low of 04/23/2012 in order to decide which count is valid.

If 04/23/2012's low is breached, the wave count of 04/28/2012's post becomes valid.  Otherwise, last weekend's count is valid.
作者: snowrider    时间: 2012-5-7 19:10

Quote from ScalperJoe:

[B]Just so I understand this correctly, as this is very interesting regarding the wave count, if the futures (/ES) breached but SPX did not, which takes precedence in accurately counting the waves? [/B]


ScalperJoe - Very good point!  That is a very good question indeed!  We trade wave, which is following some natual law, so we want to trade something that has good liquidity and good volume.  The more people participate the market, the more accurate we can get from counting the wave.  It is a dilemma whether we should or should not count the wave of after hour's futures market.  The after hour's trading is much easier to be manipulated.  What I do is to have a 2-way consideration: I count both SPX and futures index.  Today's market is an example that the after hour trading penetrated 04/23's low, but in the regular hour the market tried many time without being able to breach that key support.  Now I guess that we have two possible counts:
1. ABC has completed the wave [IV], so the market is heading north for [V].
2. Or the market is heading down in a massive wave-III collapse.
作者: snowrider    时间: 2012-5-10 10:03

Quote from ScalperJoe:

Ok, so if the March low of 1,340 holds then I agree with scenario 1 that the market would rally as a wave [V] for a retest of the highs.

If it doesn't, then one target for scenario 2 downtrend is the next fib level of the bigger 5 wave pattern, which happens to correspond very closely with the Wave 1 top of around 1,293.

Given that the 100day moving average and two large daily tails offer support on the SPX chart, it seems more likely that your scenario 1 will prevail.  These corrective wave patterns are quite tricky, and definitely have more headfakes than the clearer Wave 3 pattern.
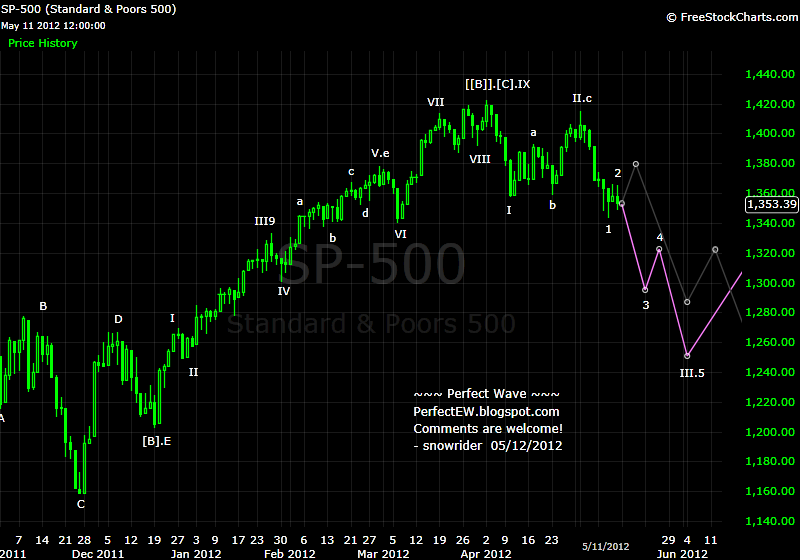
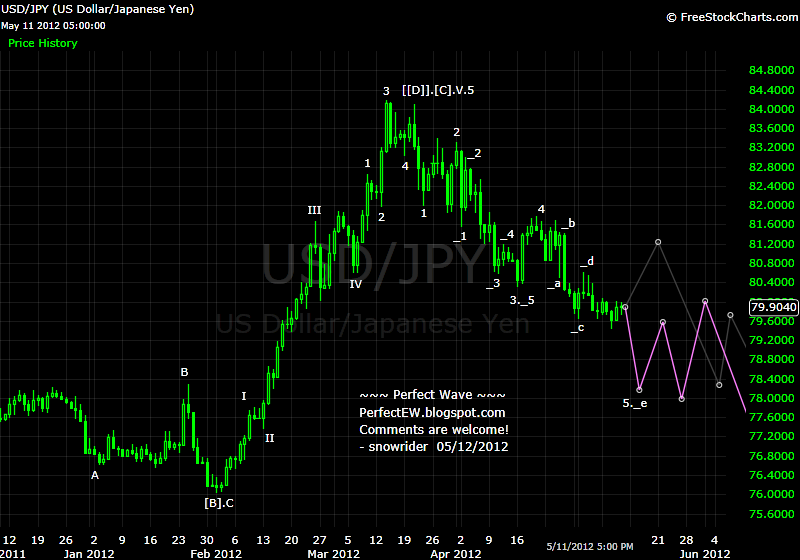
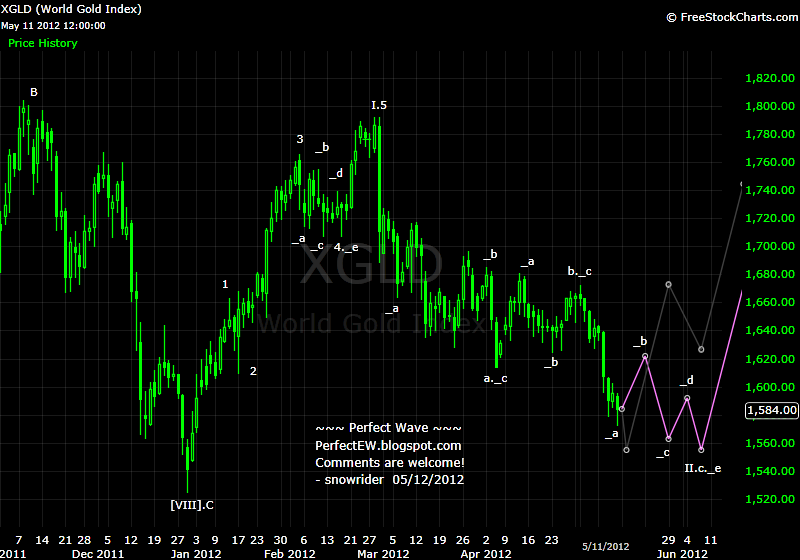
ScalperJoe - Good point!  Yes, the 1340 is the wave-4 (the lower degree wave) where a corrective wave would stop.  Thanks for summerizing those two scenarios.  Today the market gaps up, we will need to see if the gap can hold or not.  If the gap holds and market goes higher, then probably the wave-[V] is underway.  If the market fails to move up, we need to be careful that it could be forming a wave-2 (corrective wave) in the scenario #2.

(More posts and charts on my blog.)
作者: snowrider    时间: 2012-5-12 22:50

本帖最后由 snowrider 于 2012-5-13 00:09 编辑

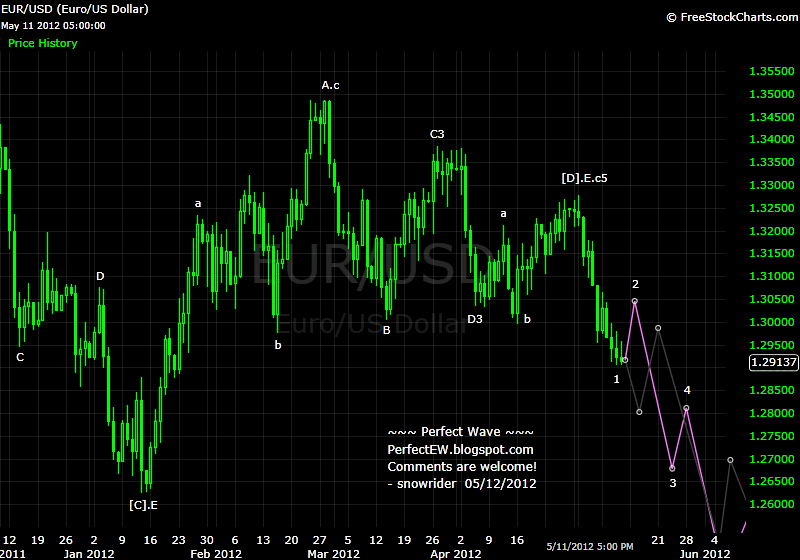
05/12/2012

Comments are welcome!


作者: snowrider    时间: 2012-5-20 14:51

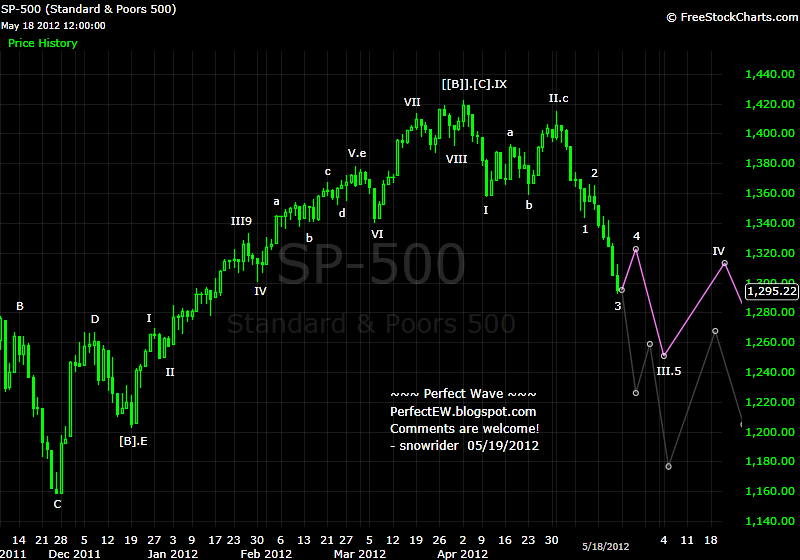
05/20/2012

Comments are welcome!


作者: hq1888    时间: 2012-5-22 22:12

本帖最后由 hq1888 于 2012-5-22 22:14 编辑

today u said wave3-4 have finished.   
how do you judge wave3-4 finish, by 30min macd crossing down?
could it be possible to have ABC,  i.e. 1st leg SPX 1295 to 1328, then down to 1315,  then tomorrow 2nd leg up to ~1340?  thanks!
作者: snowrider    时间: 2012-5-22 23:13

today u said wave3-4 have finished.   
how do you judge wave3-4 finish, by 30min macd crossing down?
could it be possible to have ABC,  i.e. 1st leg SPX 1295 to 1328, then down to 1315,  then tomorrow 2nd leg up to ~1340?  thanks!
hq1888 发表于 2012-5-22 22:12


hq1888 - Thanks for commenting.  No, I don't use any indicator.  Since the market has followed my purple line wave count the past two week (accurately to even each reversal day), I would rather believe that the market will continue following my purple line wave count until it says otherwise.  Yes, it could be the ABC scenario if today's day high is penetrated.  It could be anything.  Since the current preferred count works pretty well, I would like to take your idea as an alternative count.
作者: snowrider    时间: 2012-5-27 03:16

05/27/2012

Comments are welcome!


作者: snowrider    时间: 2012-5-29 22:56

本帖最后由 snowrider 于 2012-5-29 23:00 编辑

(More on my blog) 應同學及粉絲們的要求 ... 謝謝大家捧場

作者: snowrider    时间: 2012-6-3 02:50

06/03/2012

Comments are welcome!
(More on my blog)


作者: snowrider    时间: 2012-6-7 00:17

06/06/2012

SP update -


作者: 胡同儿串子    时间: 2012-6-7 13:01

06/06/2012

SP update -
snowrider 发表于 2012-6-7 00:17


拭目以待!谢谢!
作者: not4weak    时间: 2012-6-9 15:28

回复 39# snowrider
阿血雪,这个图很费解,
如果50%50%的话,怎末应用啊?
作者: snowrider    时间: 2012-6-10 13:33

06/10/2012

Comments are welcome!


作者: snowrider    时间: 2012-6-17 00:29

Wave Count


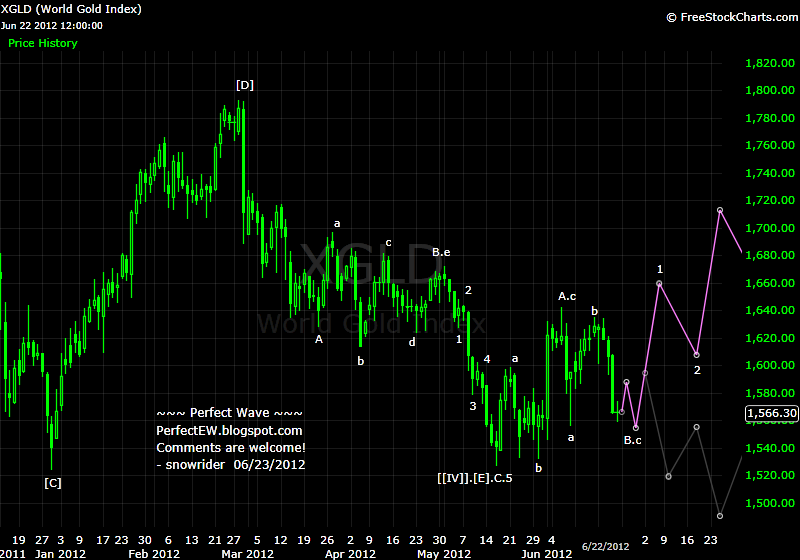
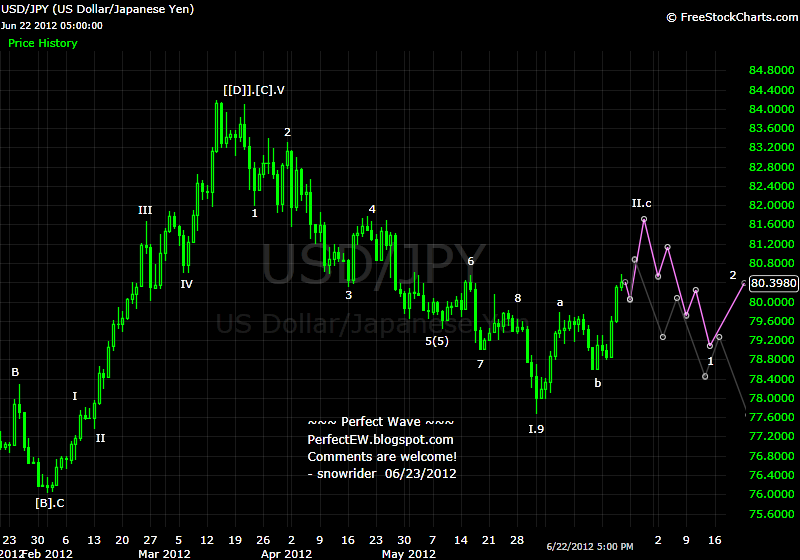
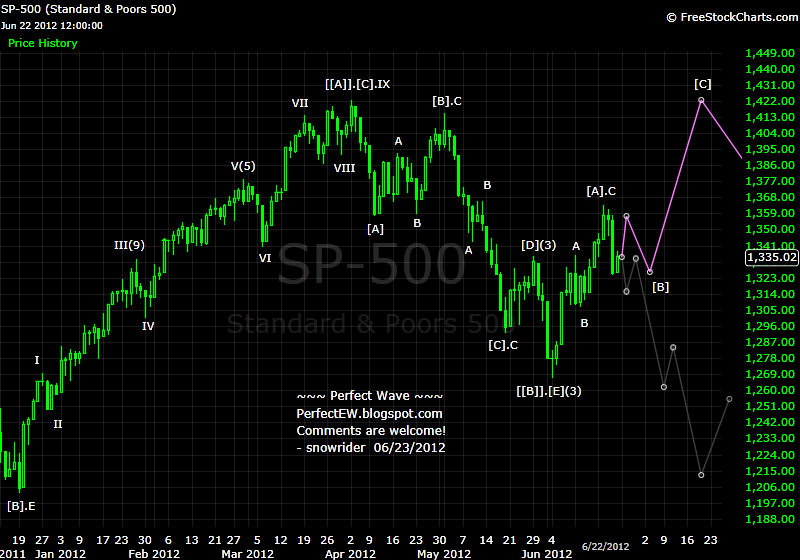
作者: snowrider    时间: 2012-6-24 15:30


作者: snowrider    时间: 2012-6-27 22:41

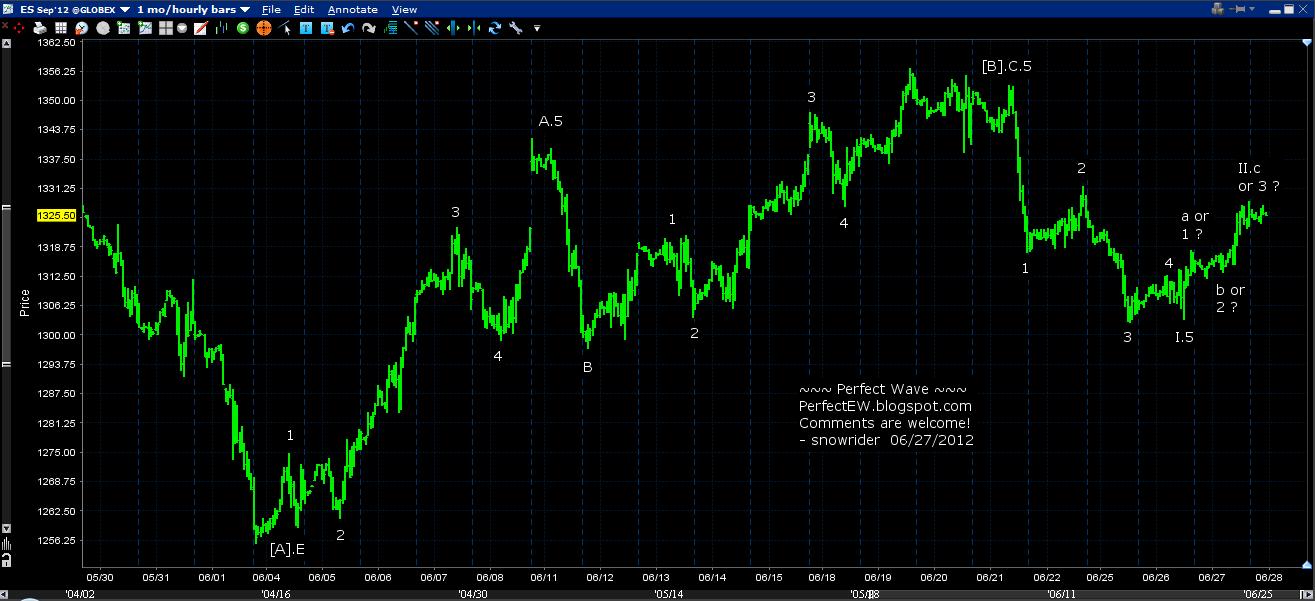
Wave Count - SP Intraday


作者: dvork    时间: 2012-6-28 16:05

回复 45# snowrider


    拉回来一点


欢迎光临 华人论坛 (http://ftp.yayabay.com/forum/) Powered by Discuz! 7.2